
As a student, I wanted an international career, and I was not disappointed. Travel has been part of my daily life all along: as a field engineer, at SLB, as an entrepreneur, and now as CTO of GOWell. Going out to meet other people is one of the ways I have built myself.
From Canada to Singapore, by way of the North Sea, Sakhalin and Africa: my travel history since 2006, in one map and a few numbers.
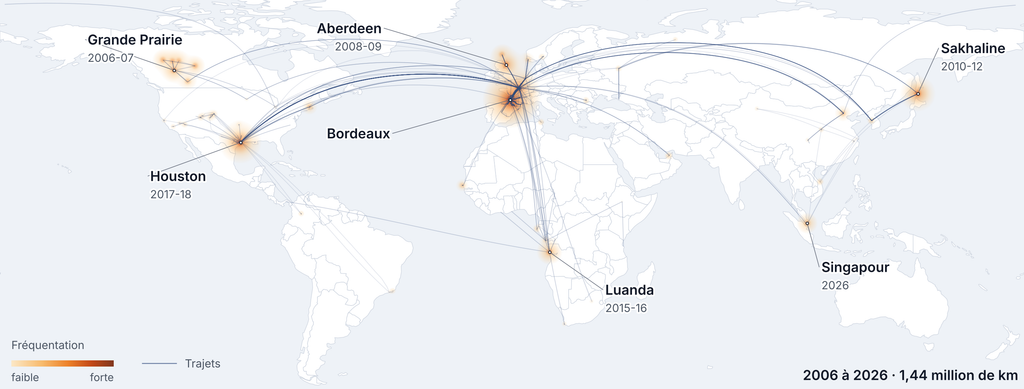
My career started in the field, as a field engineer with Schlumberger, and it was written in stopovers. When I retrieved my phone’s location history, I wanted to see it all at a glance: where have I really lived, where have I passed through, and how many kilometers does it all add up to?
Since May 2012, Google Maps Timeline has recorded my locations: nearly 300,000 data points. For the six years before that, there is no GPS. So I reconstructed those trips from memory, keeping to the real stopovers.
2006-2007 Canada, from training to the field
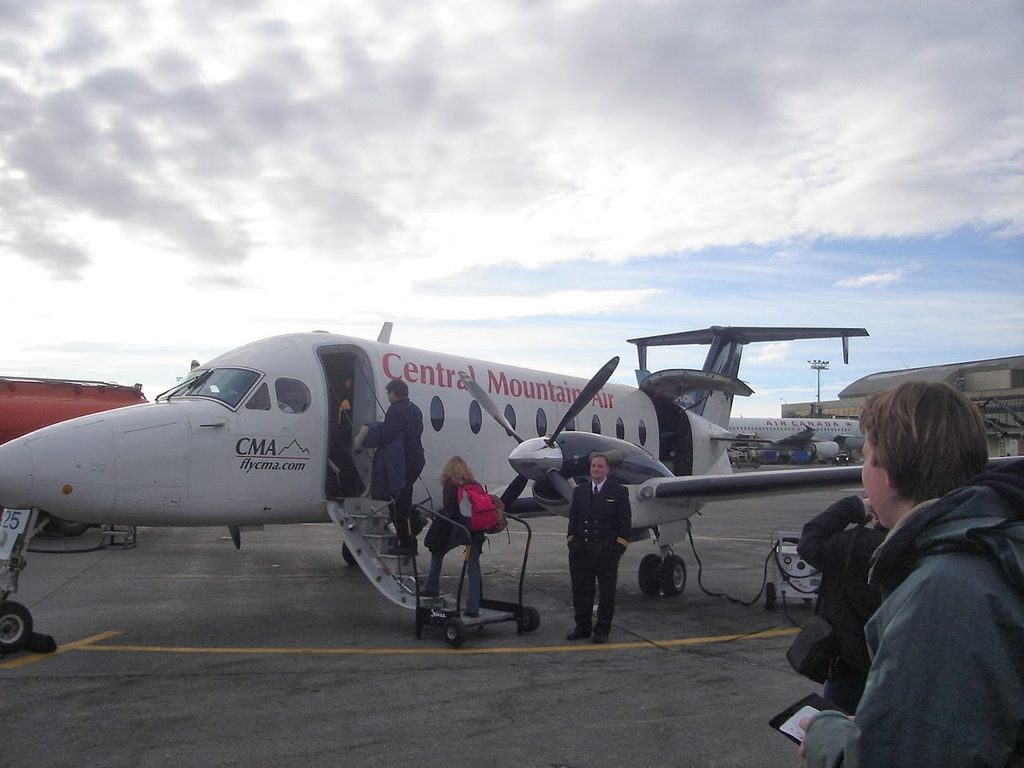
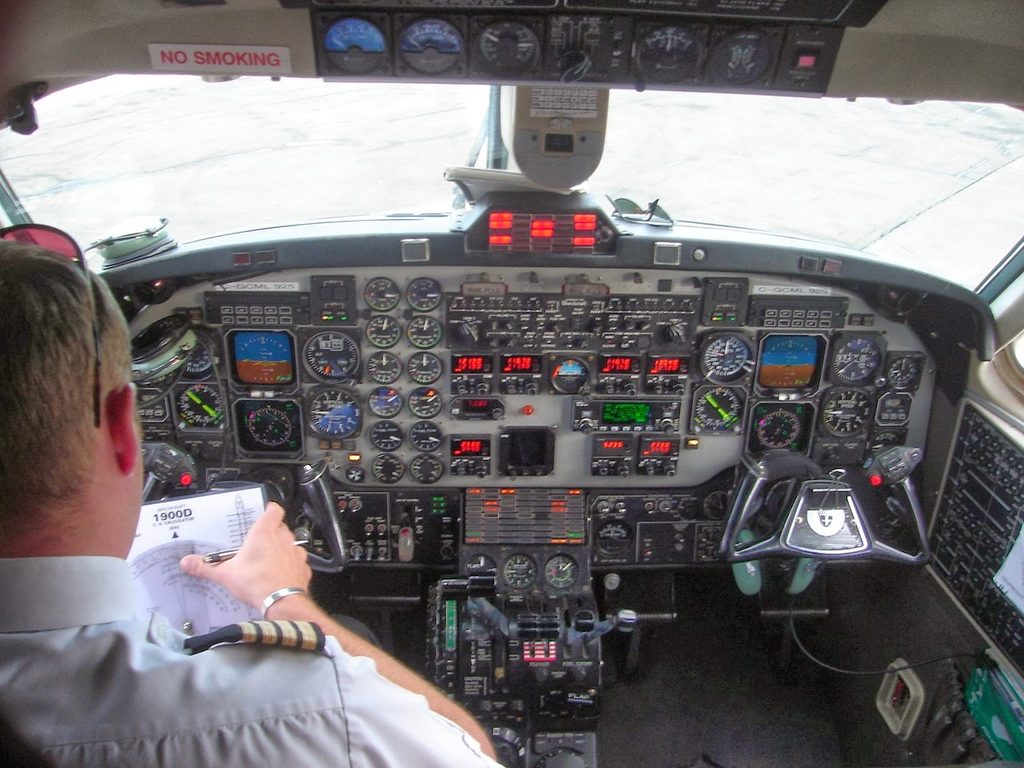
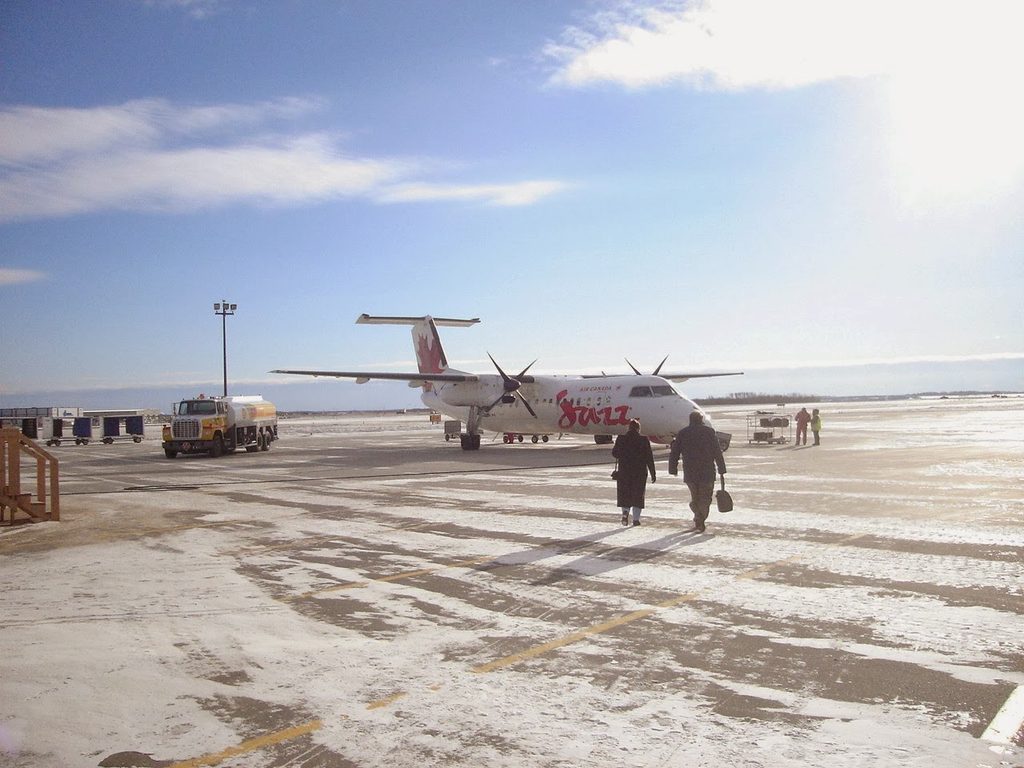
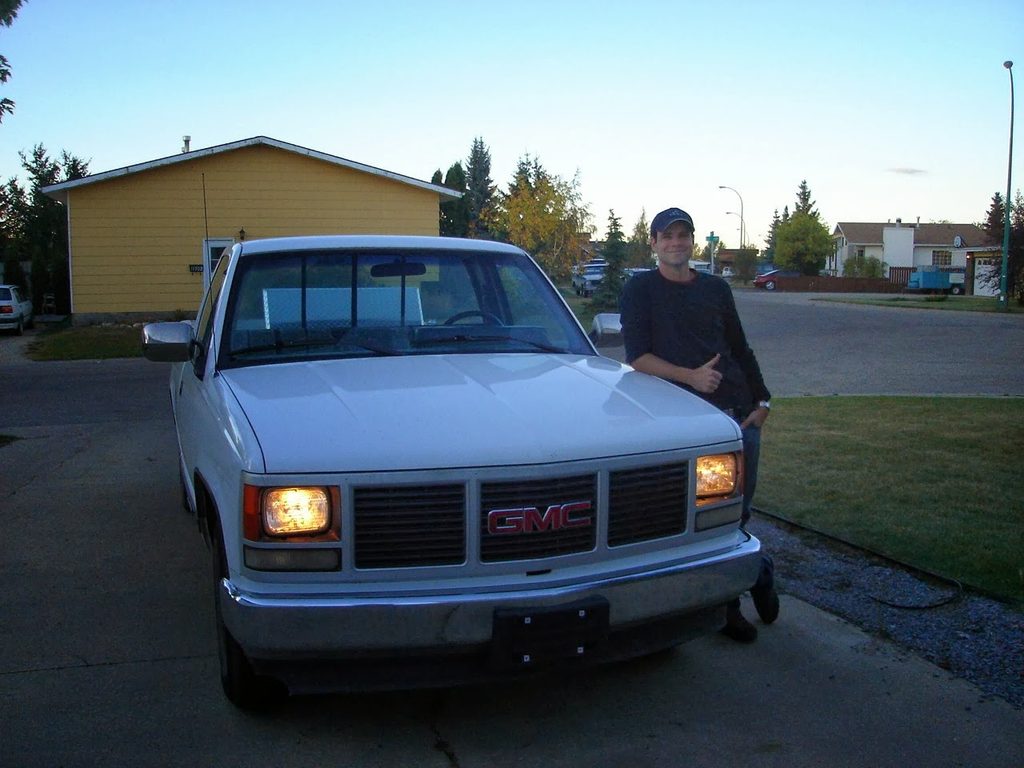
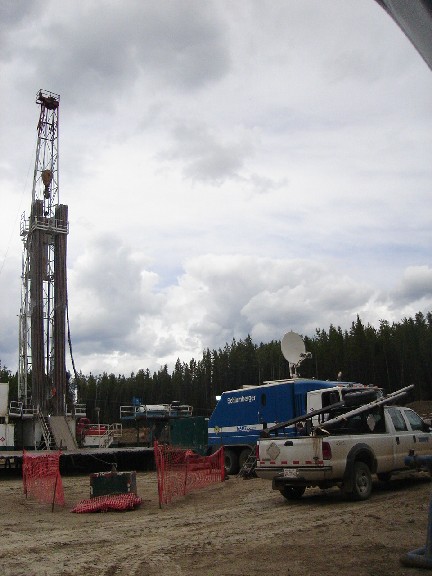
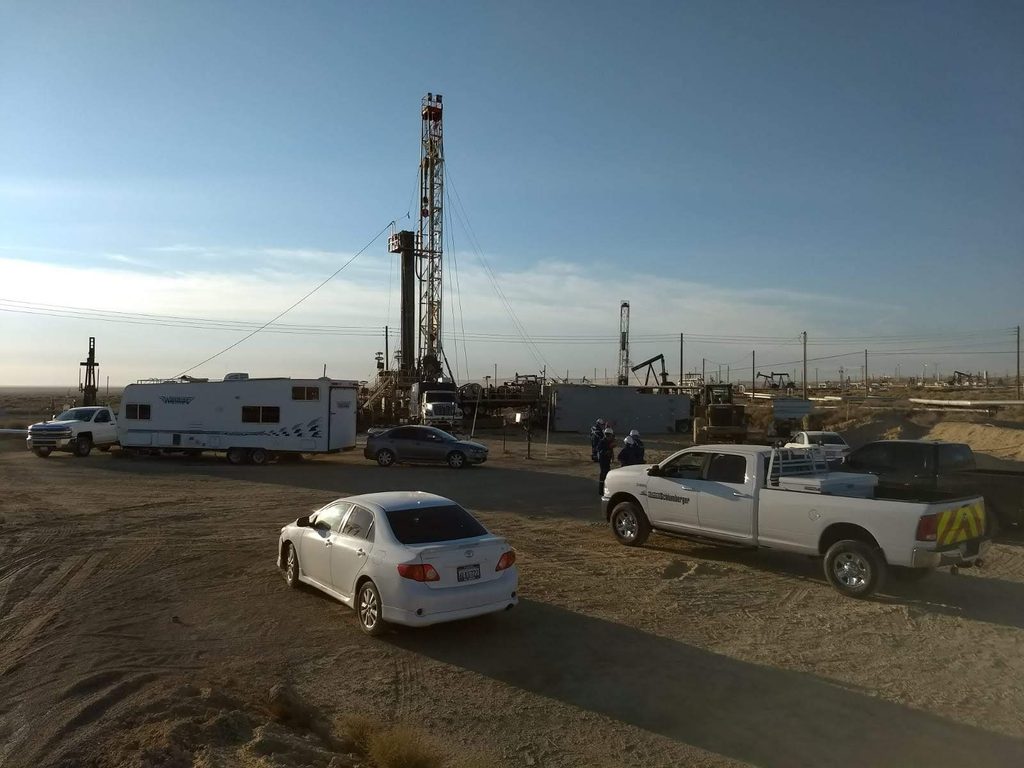
It all begins in Airdrie, near Calgary, on January 2, 2006, with field engineer training, then in Grande Prairie, Alberta. I work in the northern oil fields: Fort Nelson, Rainbow Lake and High Level are among the farthest north, and the Fort McMurray area rounds out the territory.
Two or three times a year, I fly home to Bordeaux. The route always goes through Calgary, Minneapolis or Detroit, then Paris.
2008-2009 Aberdeen and the North Sea
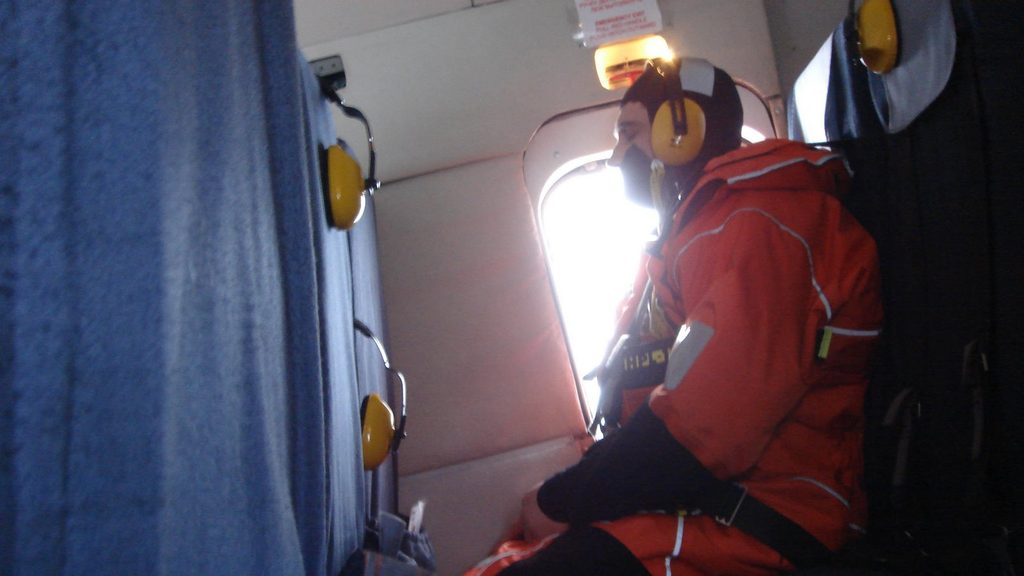
Next stop, Scotland. From Aberdeen, I work offshore in the North Sea, west of the Shetland Islands, on two-week rotations two or three times a year. Very often by helicopter.
One rule holds for this whole period: you never go straight from one assignment to the next. Between Canada and Aberdeen, then between Aberdeen and Russia, the stopover is always Bordeaux, mostly via Paris.
2010-2012 Sakhalin, at the end of the road
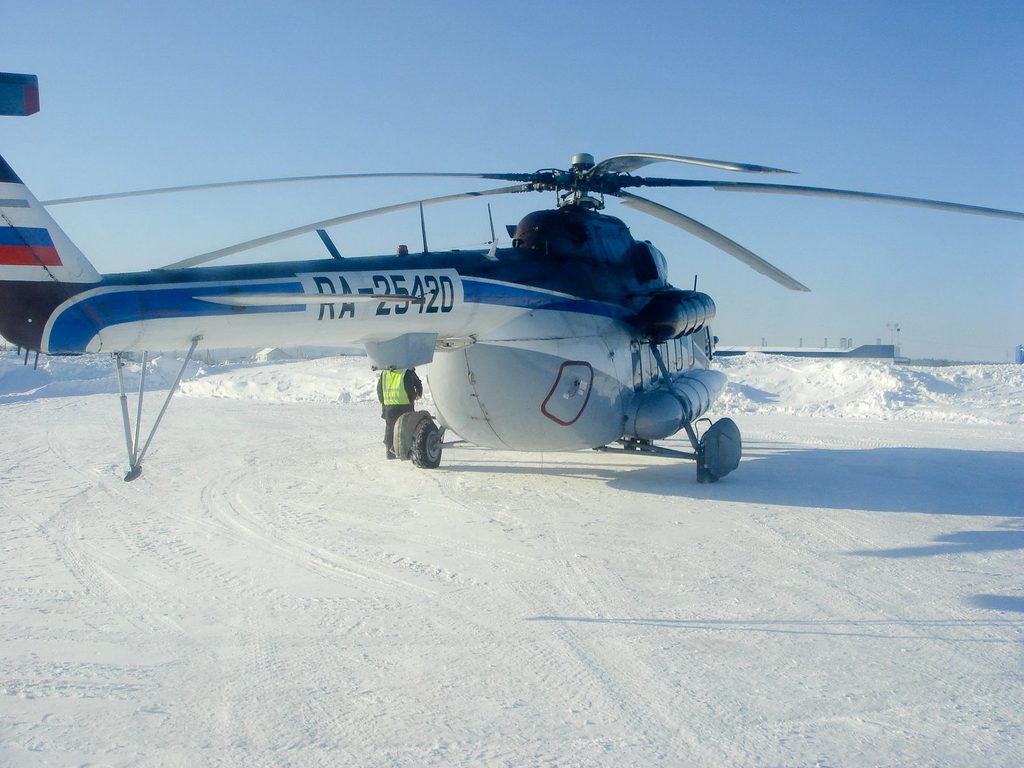
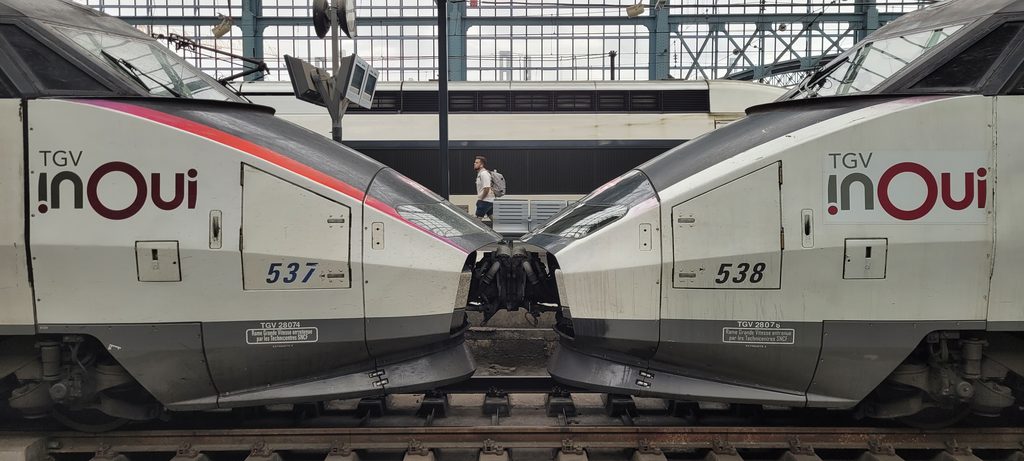
Then the Russian Far East. Getting home to France from Sakhalin Island takes three flights: Incheon in South Korea, then Amsterdam, then Bordeaux, and the same in reverse on the way back.
In spring 2012, a round trip from Sakhalin to Moscow, then on to Usinsk in northern Russia. A few weeks later, my phone starts recording.
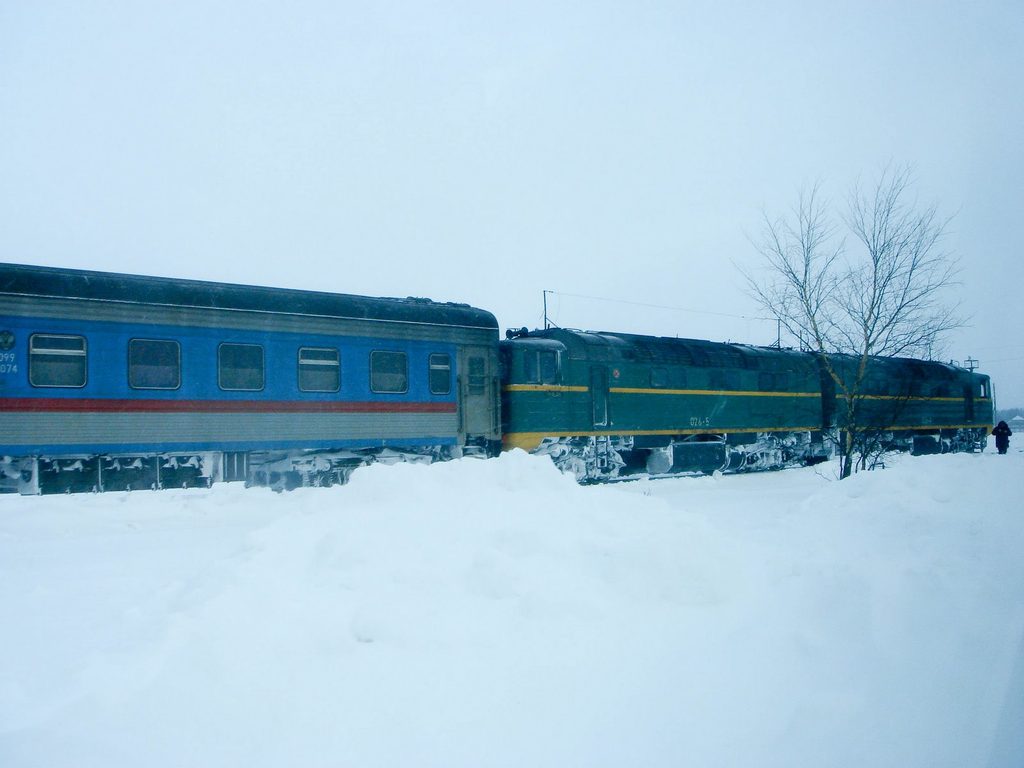
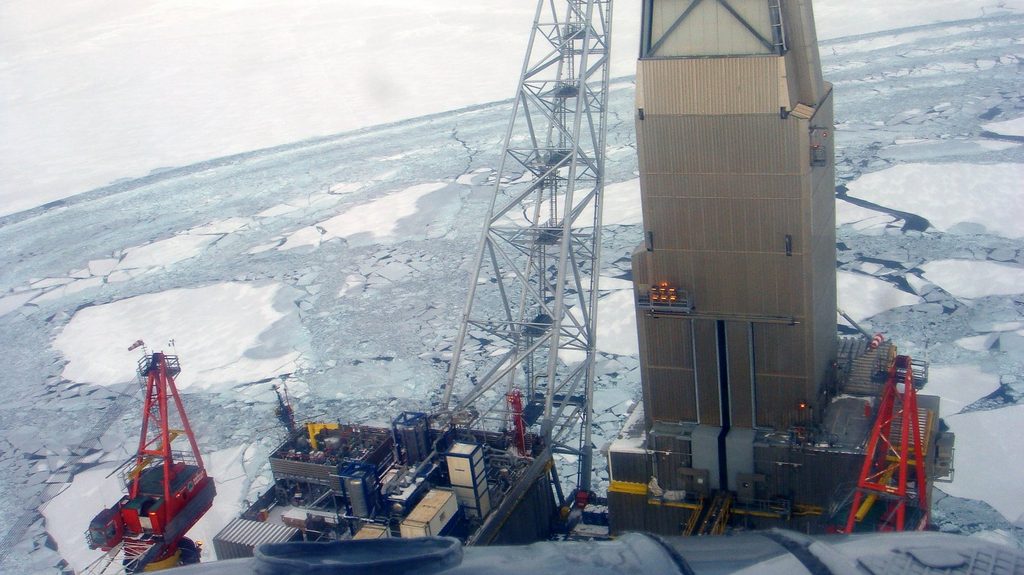
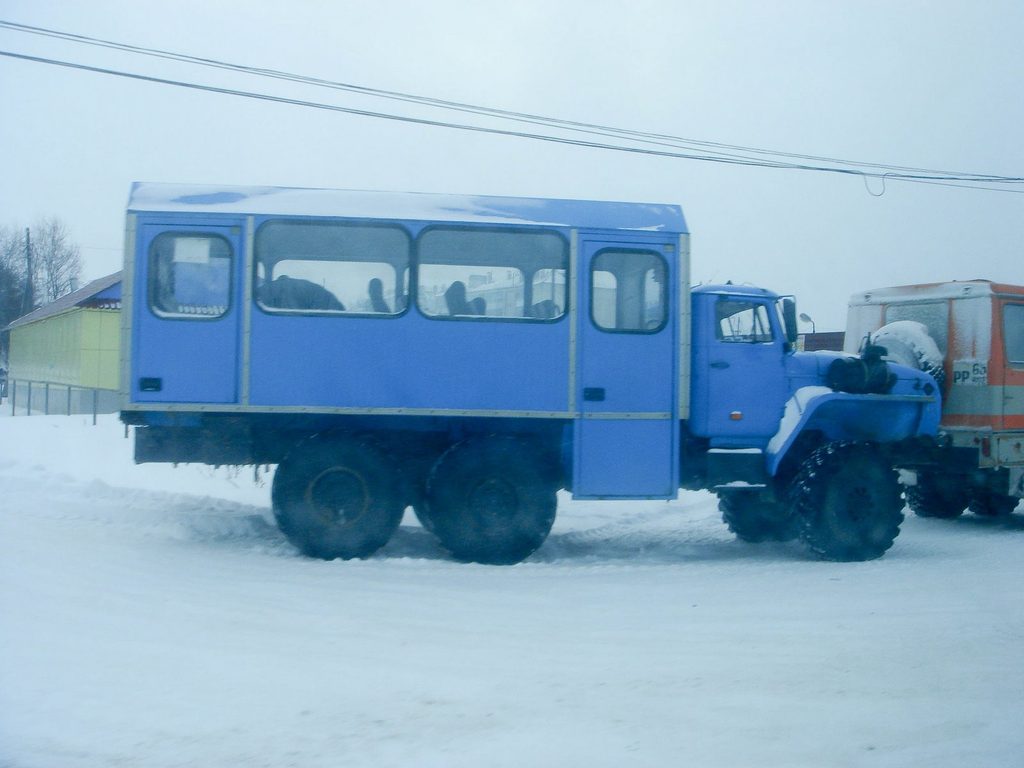
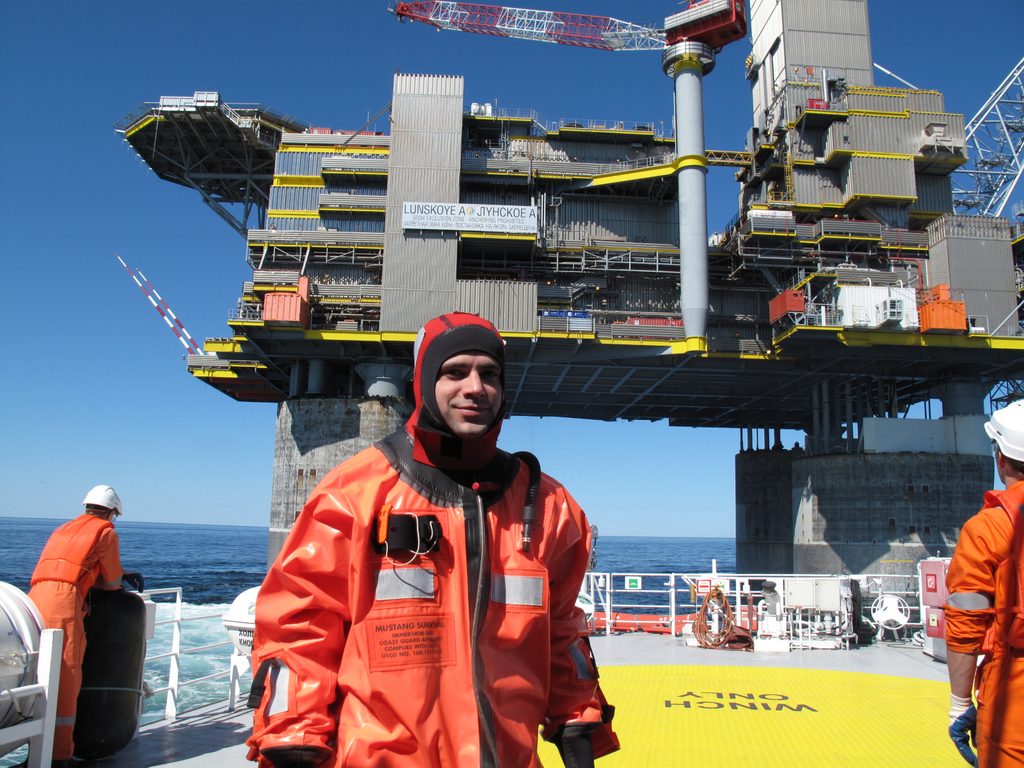
2012-2016 The data becomes real, Africa arrives
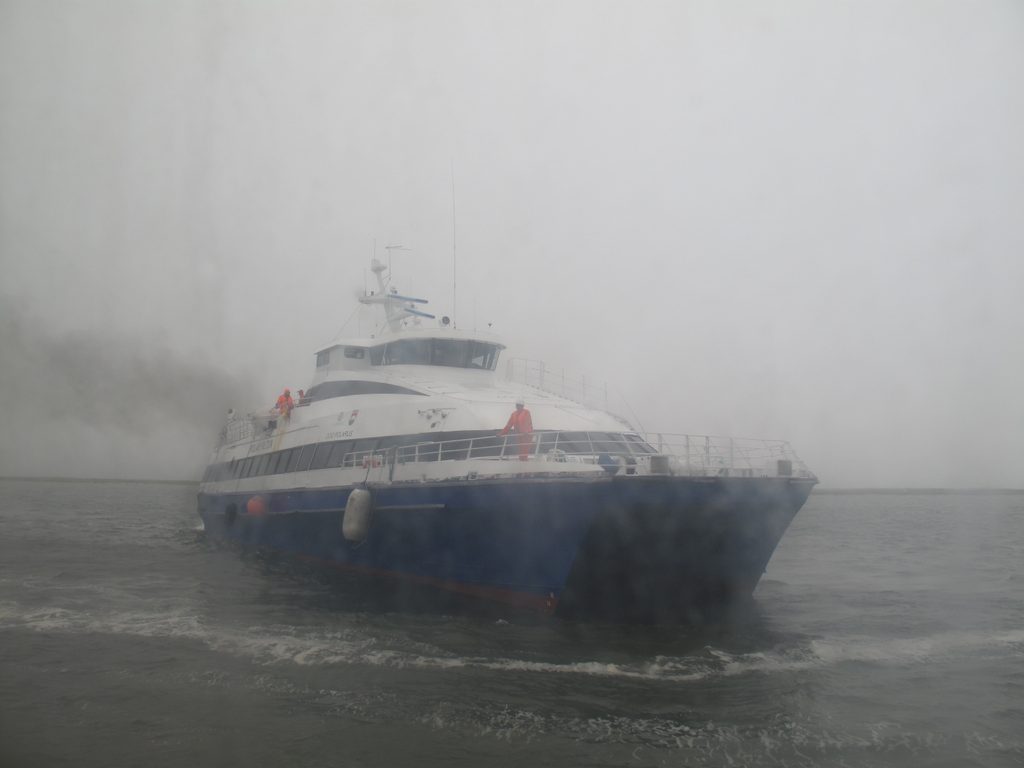
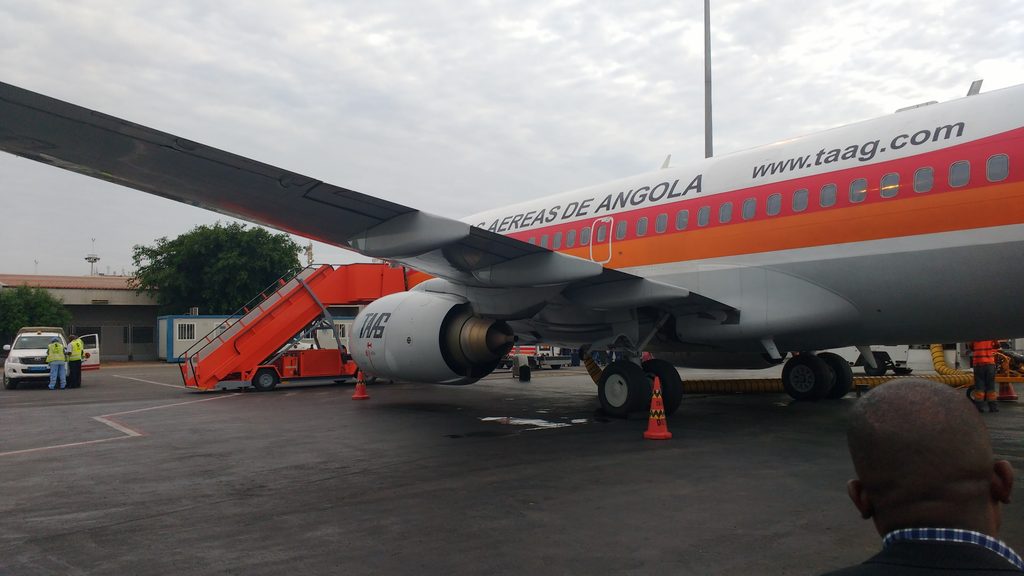
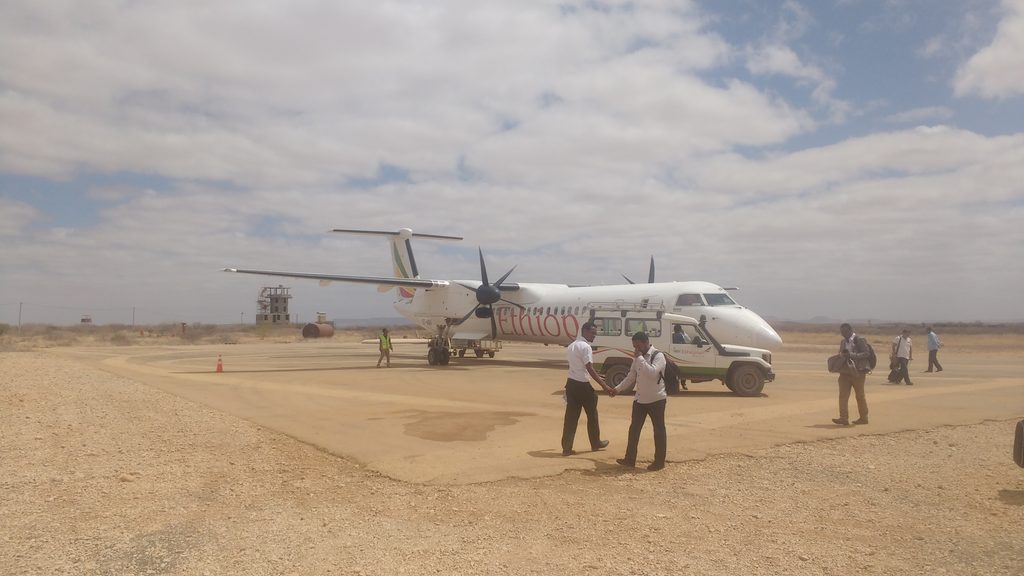
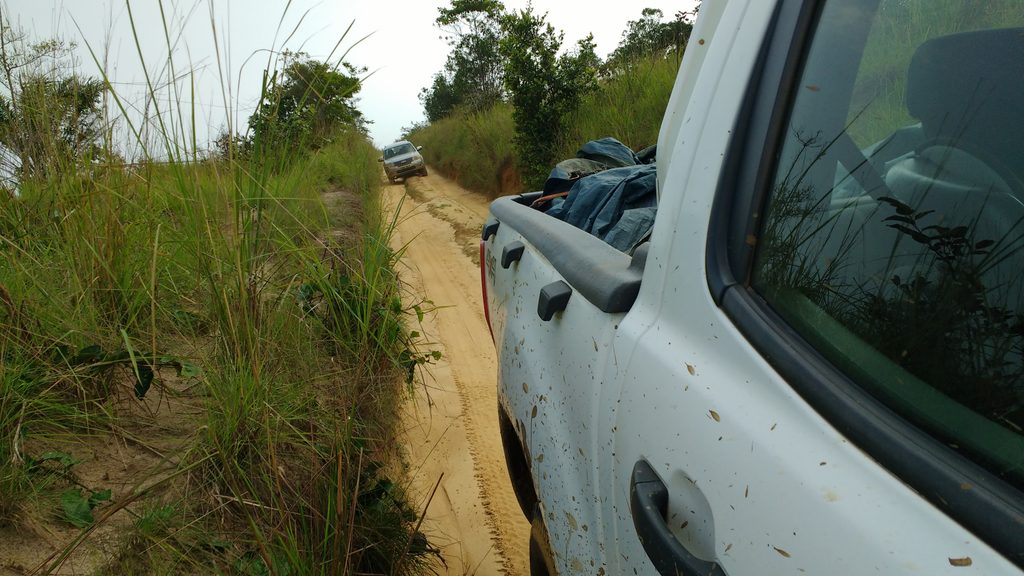
2012 and 2013 are still split between Sakhalin and Bordeaux. Then Luanda, Angola, becomes my home base in 2015 and 2016, with a stay in Pointe-Noire, Congo, in 2016.
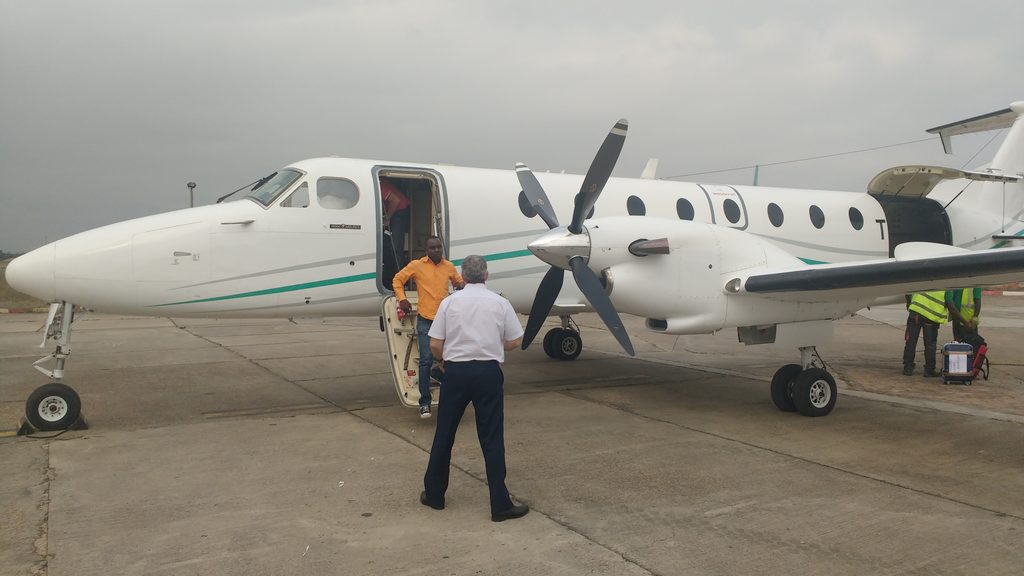
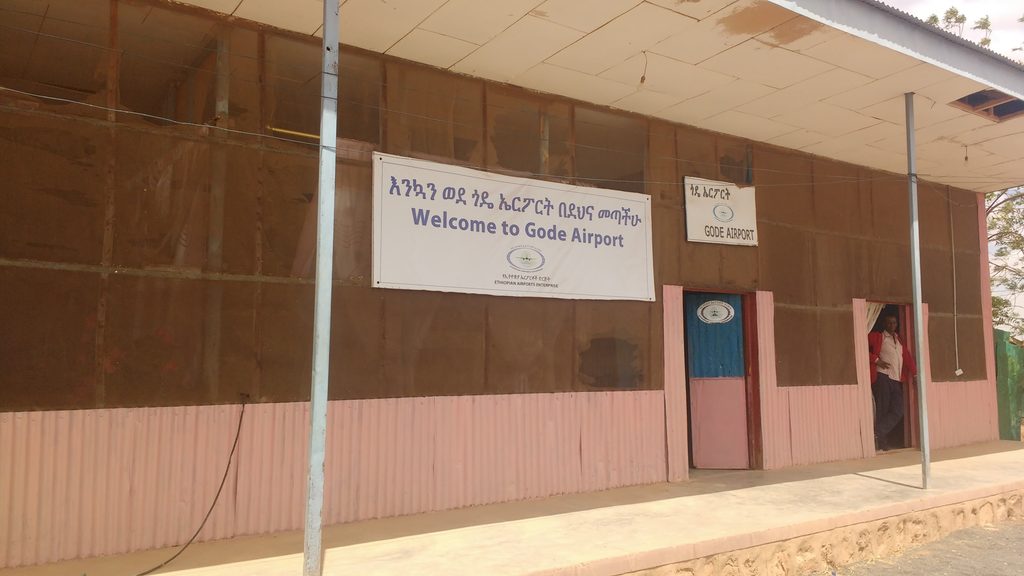
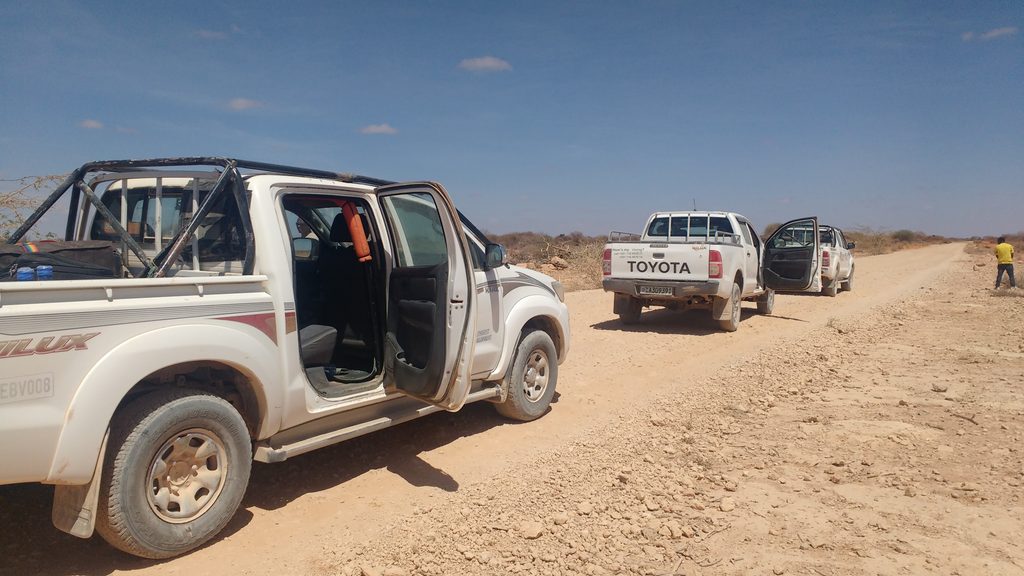
From Pointe-Noire, a few regional flights: Addis Ababa to reach Tanzania, Libreville for Côte d’Ivoire, as well as Chad and Ghana. South Africa appears in 2015, from Johannesburg to Cape Town.
2017-2019 Houston, Paris, and the record year
Houston accounts for nearly three quarters of my locations in 2017 and nearly two thirds in 2018. In 2019, Paris takes over, for more than half of the year.
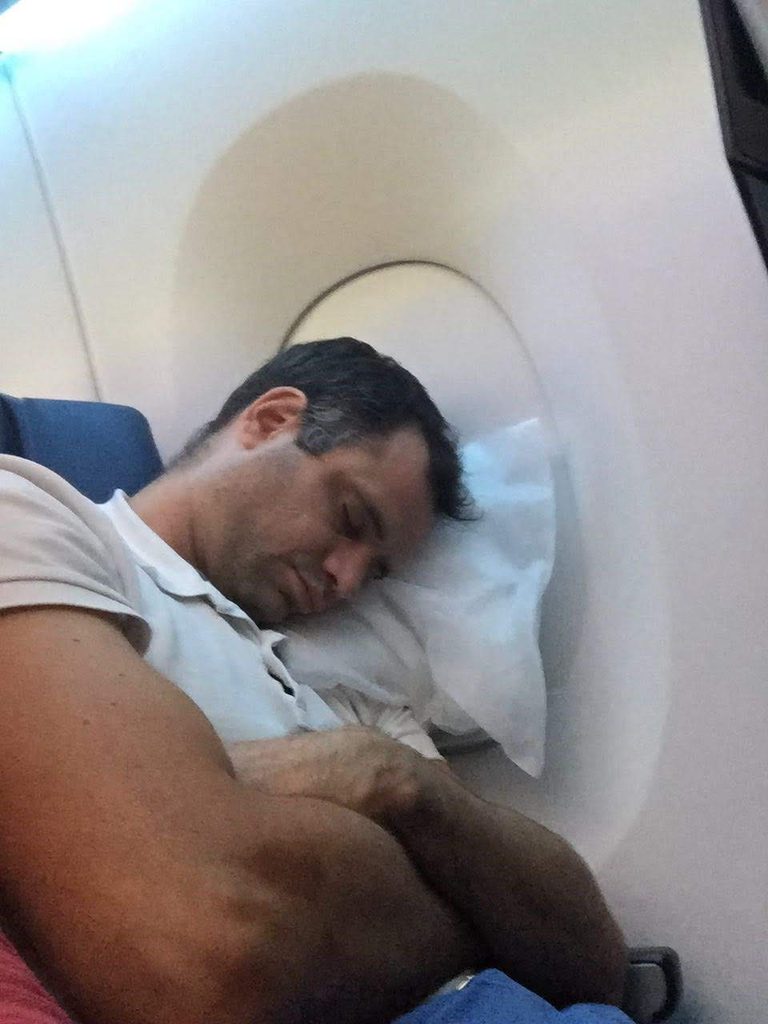
That year the counter climbs to 254,000 km: my record, or 6.3 times around the Earth in twelve months. All of it in economy class.
2020-2025 Bordeaux, the center of gravity
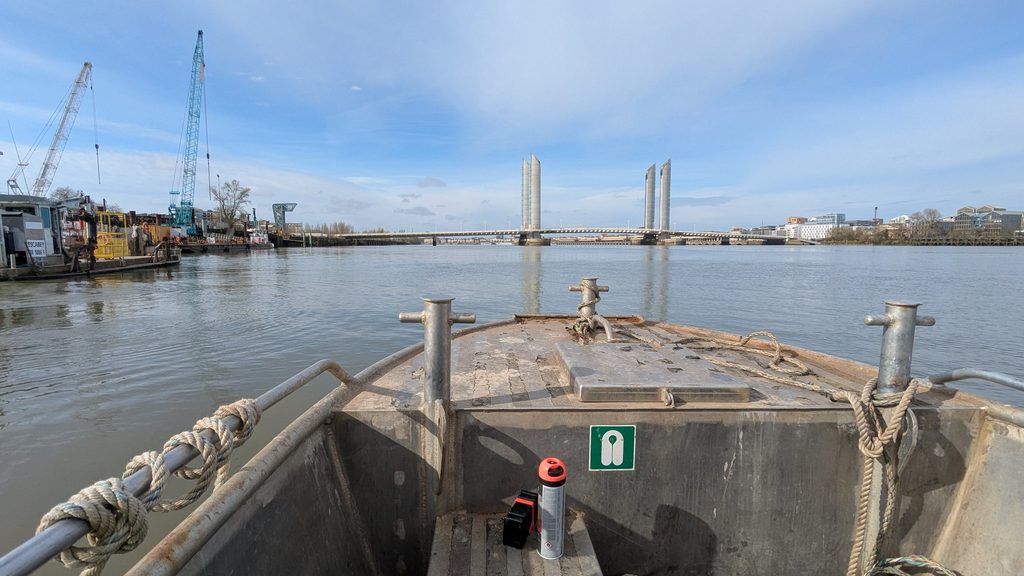
Then everything slows down. In 2020, I travel only 31,000 km, eight times less than the year before. Bordeaux becomes my home base again: 55 to 80% of my locations, depending on the year. Between 2021 and 2025, I settle at 22,000 to 56,000 km a year.
2026 Singapore
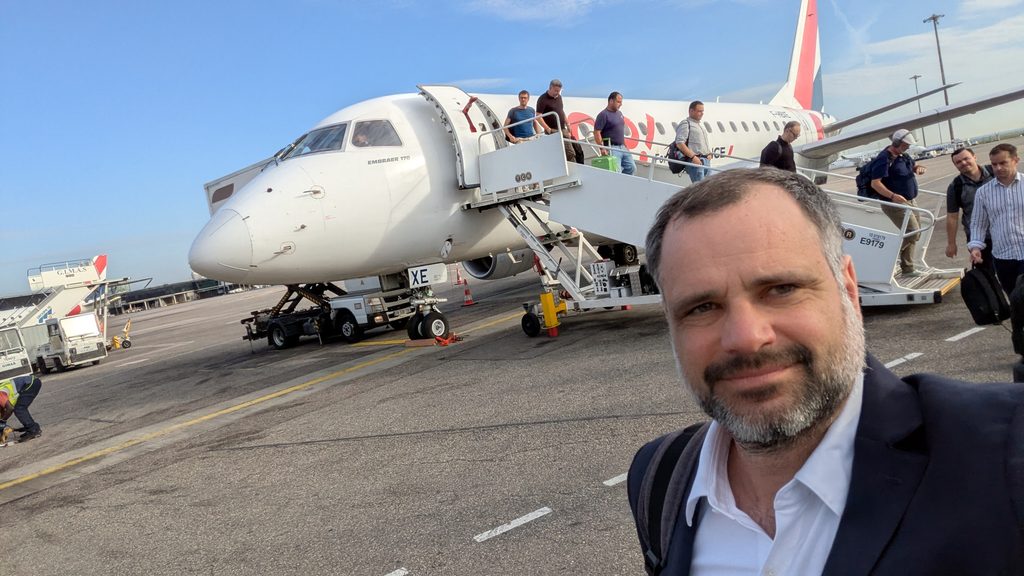
2026 opens a new chapter: CTO of GOWell since January, and a move to Singapore in August. As of September 12, the counter for the year already reads 137,000 km.
The numbers
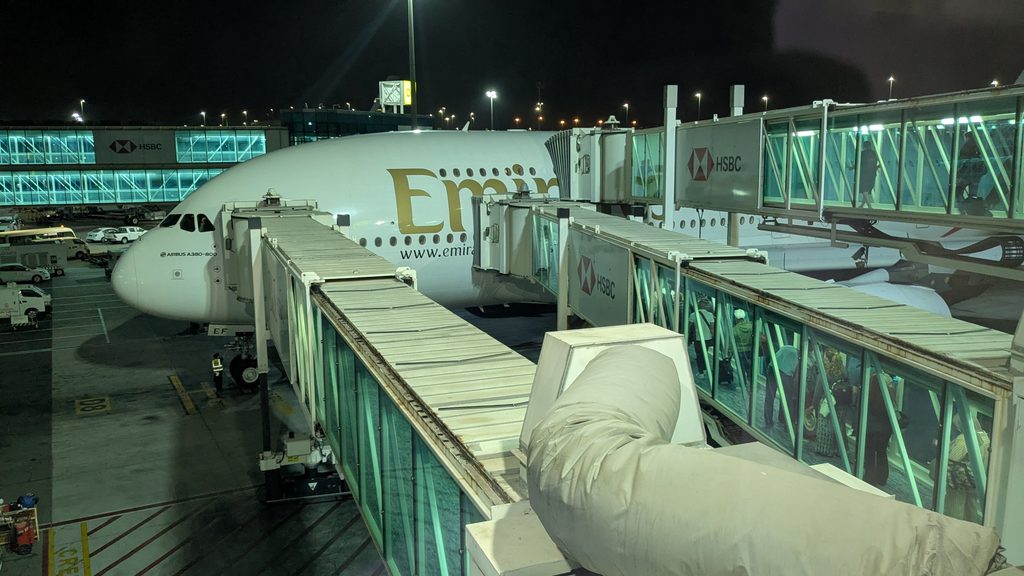
In total, 1,440,000 km, or 35.9 times around the Earth. Flying accounts for 70% of that distance. Driving adds up to about 320,000 km, and trips on foot, by bike, running or skiing exceed 10,000 km.
Distance by mode of transport
Cumulative kilometers from 2006 to 2026. The “undetermined” mode covers trips Google could not classify.
Kilometers traveled per year
All modes combined. 2026 stops at September 12.
See the data by year
| Year | Measured (km) | Reconstructed (km) | Total (km) |
|---|---|---|---|
| 2006 | 0 | 68,862 | 68,862 |
| 2007 | 0 | 107,183 | 107,183 |
| 2008 | 0 | 19,152 | 19,152 |
| 2009 | 0 | 13,620 | 13,620 |
| 2010 | 0 | 54,928 | 54,928 |
| 2011 | 0 | 73,670 | 73,670 |
| 2012 | 18,321 | 32,095 | 50,416 |
| 2013 | 11,584 | 0 | 11,584 |
| 2014 | 1,407 | 0 | 1,407 |
| 2015 | 37,514 | 0 | 37,514 |
| 2016 | 61,275 | 22,046 | 83,322 |
| 2017 | 80,600 | 0 | 80,600 |
| 2018 | 215,069 | 0 | 215,069 |
| 2019 | 253,689 | 0 | 253,689 |
| 2020 | 31,255 | 0 | 31,255 |
| 2021 | 21,728 | 0 | 21,728 |
| 2022 | 34,109 | 0 | 34,109 |
| 2023 | 55,896 | 0 | 55,896 |
| 2024 | 35,069 | 0 | 35,069 |
| 2025 | 54,147 | 0 | 54,147 |
| 2026 | 136,976 | 0 | 136,976 |